Sales Forecast
System instructions
There are several pre-requisites for using the Forecast Module, they are the following:
Pre- requisites settings
In Account > Settings > Sales, scroll down to Forecast:
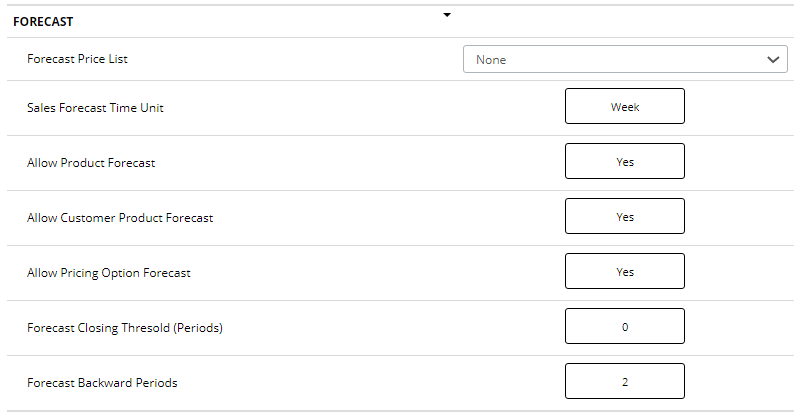
The settings work like this: • Forecast Price List: You may select a price list for forecasts • Sales Forecast Time Unit: You may select any time unit from the following options: week, day, quarter, month, though currently the only available option for Forecasts is Weeks. • Allow Product Forecast: This option defines whether or not we can forecast on specific products. • Allow Customer Product Forecast: This option defines whether or not we can forecast on Customer Products. This option is currently not available. • Allow Pricing Option Forecast: This option defines whether or not you can use pricing options for forecasting. • Forecast closing threshold (Periods): If you’d like the forecast to begin on the current week, leave this as 0. If you’d like for it to not include the current week (or more) set it to 1 (or up to 5).
Scheduled Task Scheduled Tasks You must have the following Scheduled Task enabled:
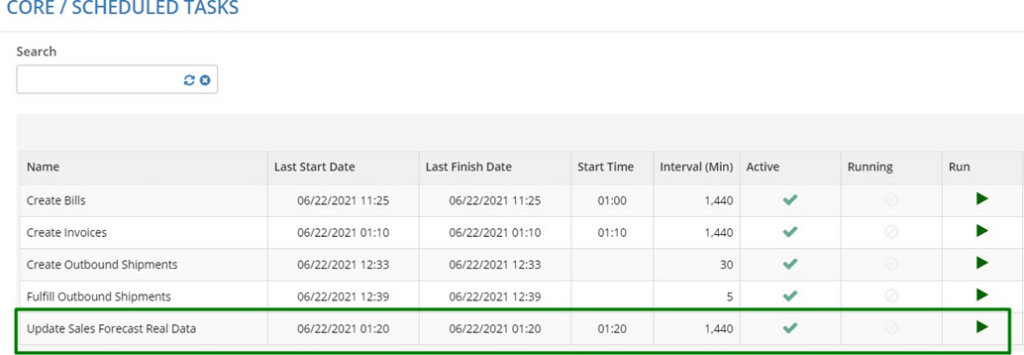
This Scheduled Task retrieves real information of sales that have already been billed.
Company Parametrization
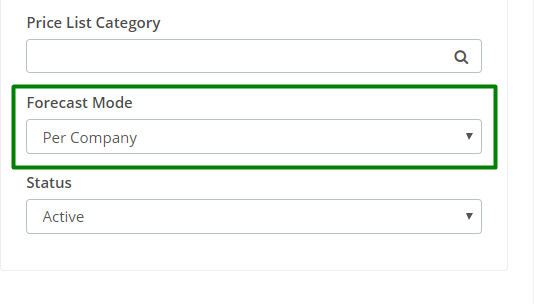
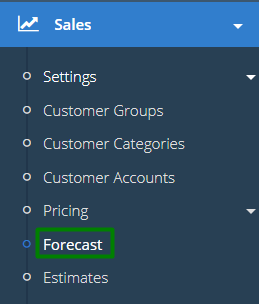
Any Customer Company that you’d like to make Forecasts about must be edited in the Business Network as follows: On the bottom left of the edit screen you will find the Forecast Mode setting. You can either choose Per Company or Per Account. The Sales Forecast Module is the place where you can create and manage forecasts for future sales. To reach this Module, go to Sales, and then Forecast:

You’ll reach the following screen:
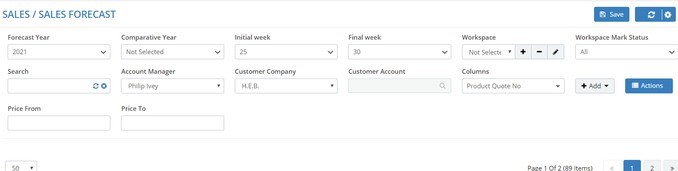
To begin a Forecast, fill out the following fields: • Forecast Year: What year is your forecast going to be on?. • Initial Week: When will the forecast begin?. • Final Week: When will the forecast end?.
• Account Manager: The Customer Companies that appear will be based on the Account Manager selected. Those are the minimum fields required for a Forecast. You may also complete: • Comparative Year: Select a year from the past to compare the data to. • Customer Company: Select a Company to focus the Forecast on. • Customer Account: If the company was set to Per Account, select the Customer Account here.
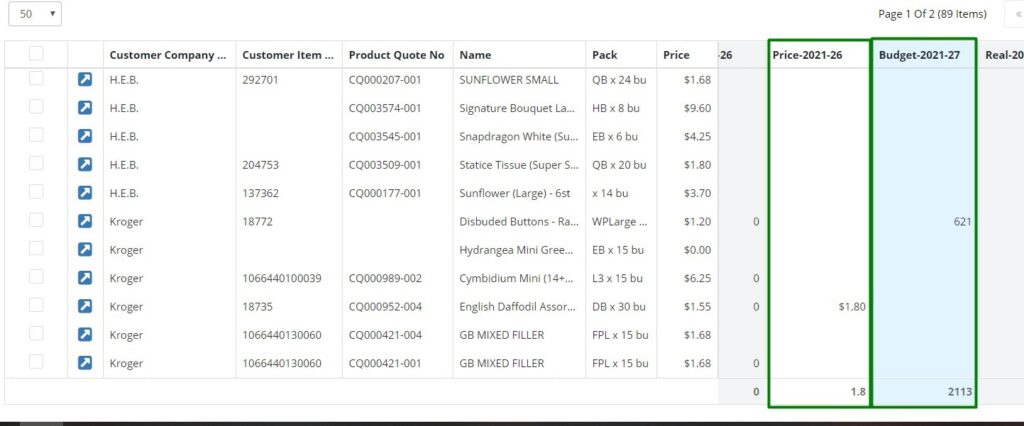
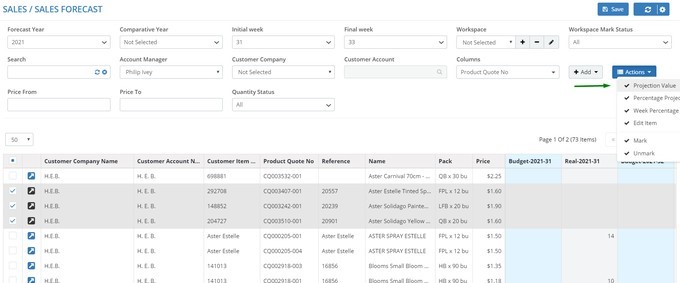
Once you fill out the required fields, a table will appear, like so:
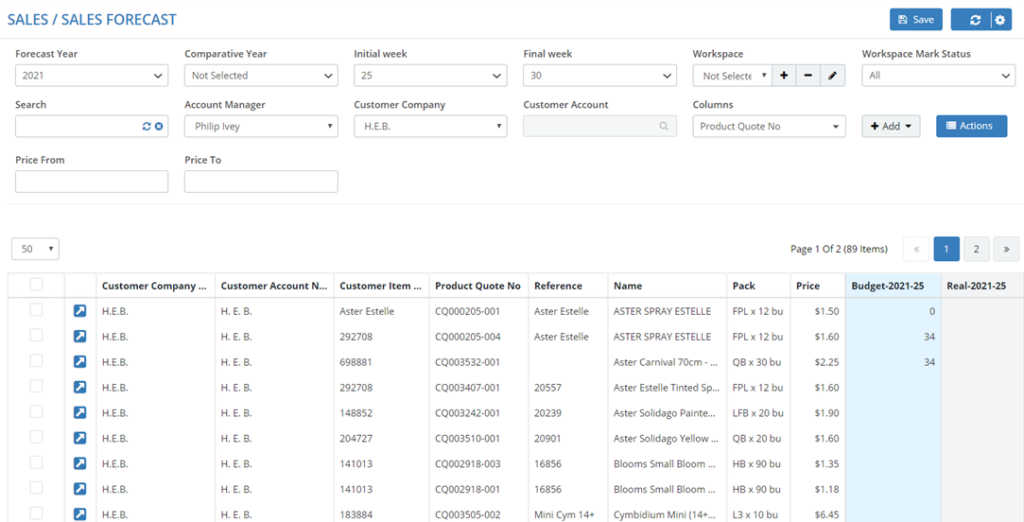
This table can be manipulated just like an Excel document. Simply remember to press Save every time you make changes to values, so you don’ t lose any.
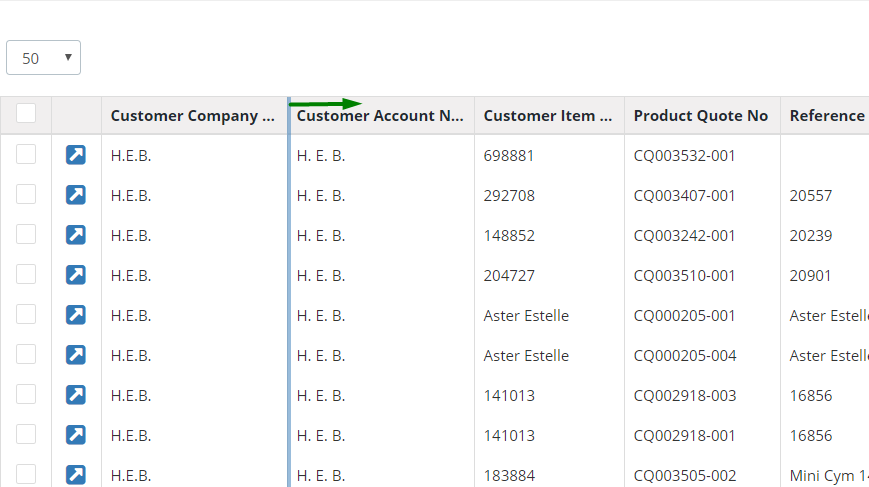
You can make the columns wider or thinner by clicking and dragging their edges like on Excel. You can make columns fixed or unfixed:
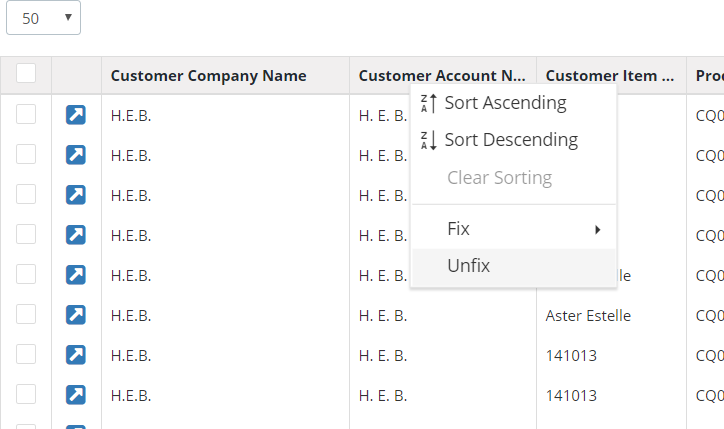
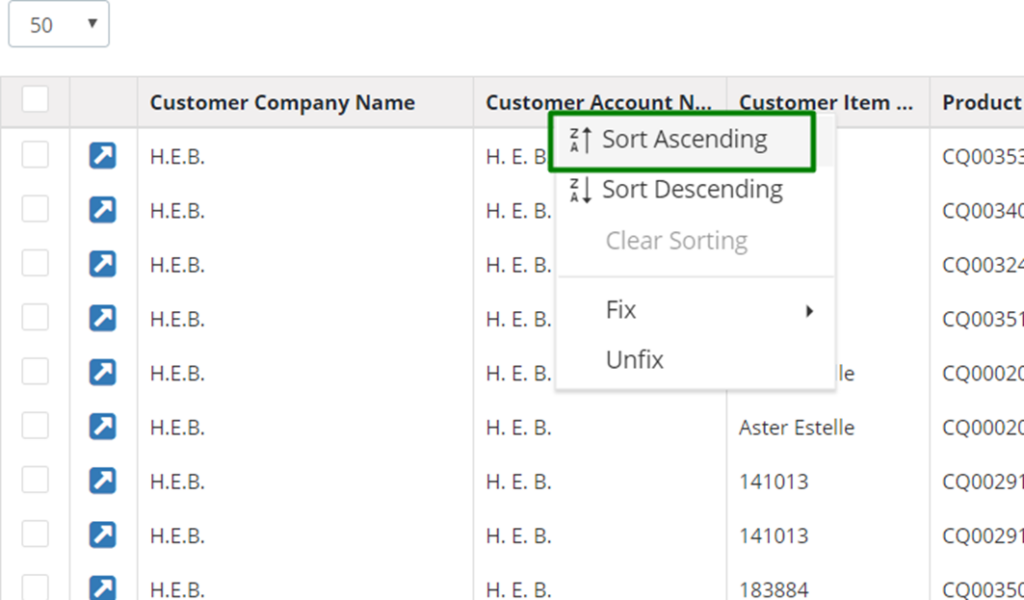
You may also sort columns in ascending or descending order:
Forecasting
The Budget Column is where you can estimate quantities. The Price (week) Column is where you can estimate Prices.
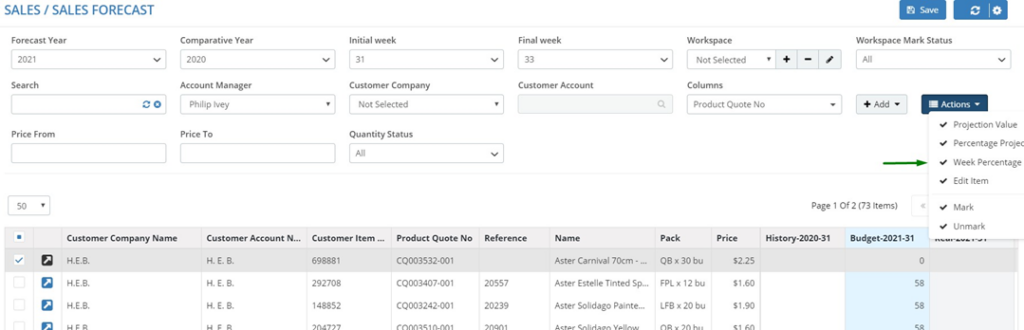
You may fill the table out manually, or you may use the Actions button. Up next we will explore each of the Actions:
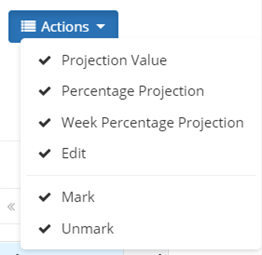
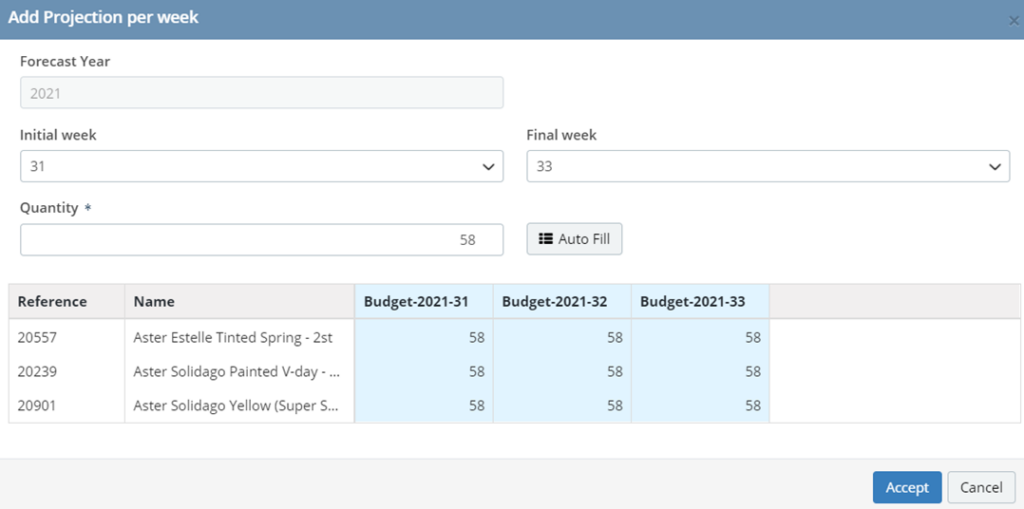
Select a line or multiple lines and click on Actions to display its drop-down menu: 1. Select Projection Value to project a Budget for each of the lines selected:
The following window will appear:
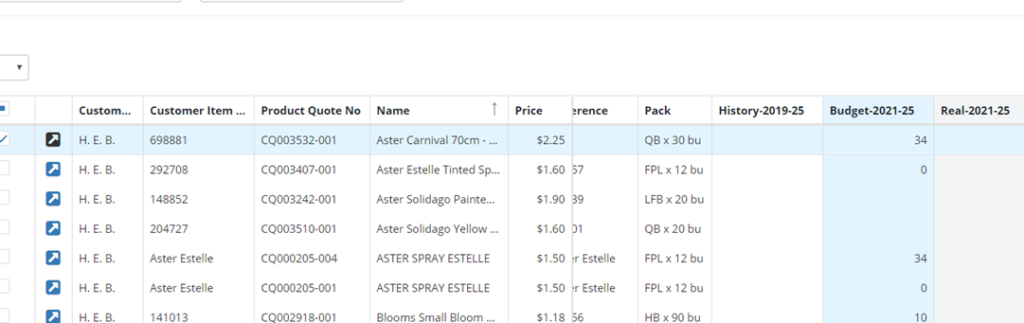
2. Select Percentage Projection if you already have some values on the table, to project a budget based on old values plus or minus a percentage. In the case of this example we have values in week 25:
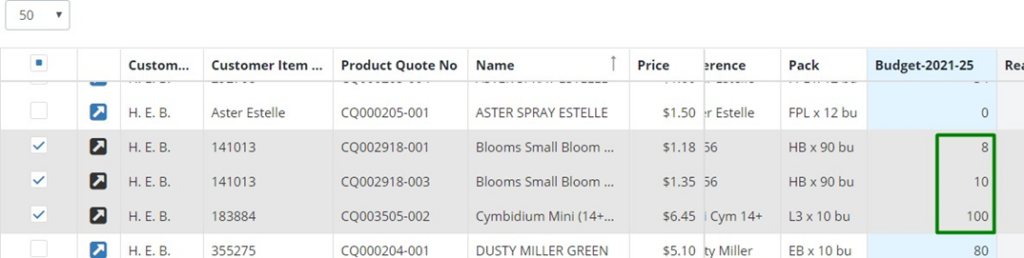
So simply select Percentage Projection and complete it as follows (select the week to base it on, and enter the percentage amount, then auto fill)
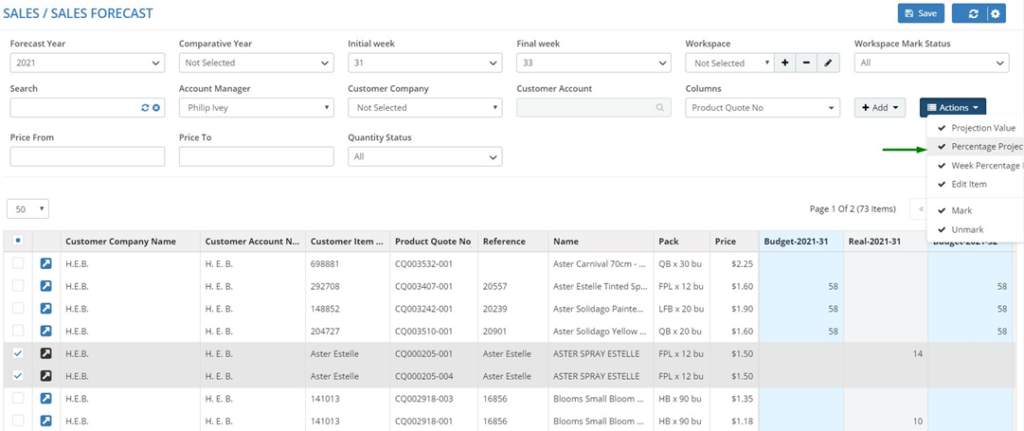
The following window will appear:

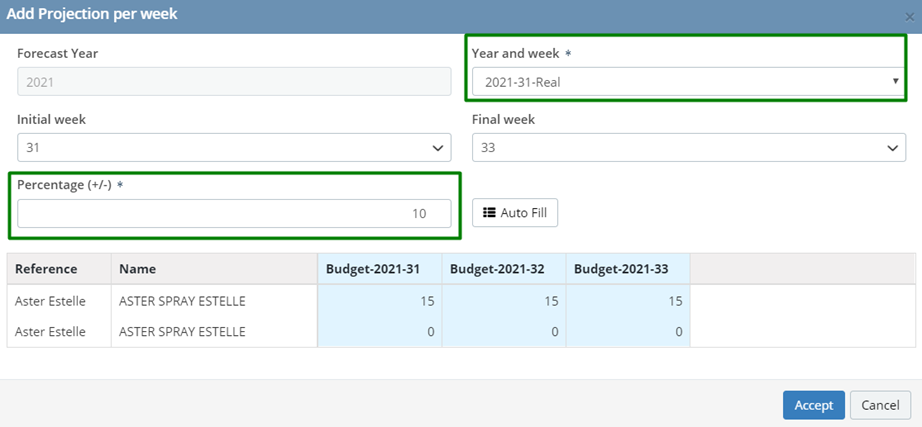
Select Week Percentage Projection to project based on the corresponding week in a previous comparative year. This only works if you have chosen a comparative year in the header. (Our example will show zero because we don’t have any data from the previous years of forecasting.)
The following window will appear:

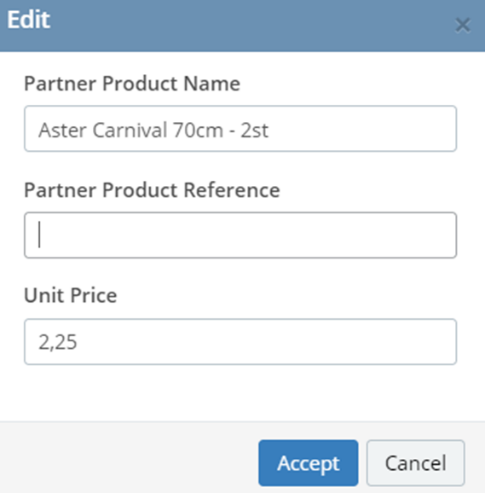
Select Edit, to change the price of the product. This change will only be reflected here, and will not make any changes elsewhere on Traze. The following window will appear:
Finally, select Mark or Unmark to mark the line with blue, to show that it has already been forecasted. You may then use the filter in the header called “Workspace Mark Status” to either display marked, unmarked, or all lines.
Filters and Additional Functions
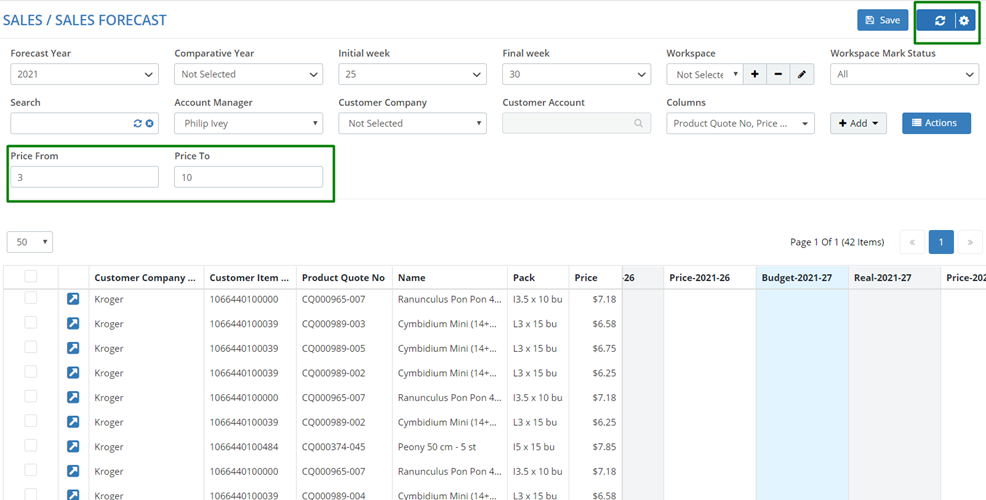
Price Range You may select a range of prices in the header to filter the lines of products. Remember to press refresh to apply the changes.
Additional Columns
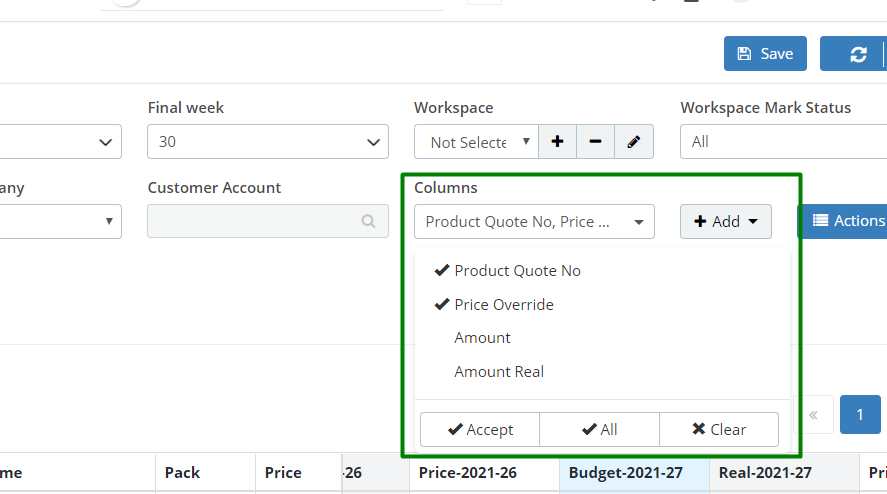
You may click on the Columns drop-down menu and add the Columns shown here. The “Amount” and “Amount Real” column calculate forecast and real costs.